During the past week DS2x86 has progressed well, and I have also started (or gone back to) working on improving the original DSx86. By the way, the version 0.24 of DSx86 was in fact not built with the absolute latest version of libnds, as a new version of libnds was released on the 5th, while I downloaded it on the 1st of February. I did not notice the new update before releasing it on the 6th. Anyways, my focus has still been on DS2x86, but I plan to slowly get up to speed with improving DSx86 as well.
DS2x86 progress
Built-in profiler
As I mentioned in the previous blog post, I wanted to add a similar profiling system into DS2x86 to what I have been occasionally using with the original DSx86, to find the performance bottlenecks and to get a feel for the overall performance of my emulator. I first coded the main profiler system (calculating the number of times each opcode in the main opcode table is called, and saving this data into a file on the SD card after the most often called opcode has been executed around a million times). This time I coded the main profiler code in ASM, while in my DSx86 version it was coded in C (which slowed down the emulation quite a lot). Now DS2x86 runs with the profiler active still a little bit faster than DSx86 without the profiler.
The next step was to add a timer to count the number of CPU cycles it takes to execute each opcode, and this is where I run into some difficulties. I had to test various methods before I found something that worked. Here are the things I tried, in order:
- All MIPS processors have a Coprocessor 0 (System Control Processor), which has various registers relating to the low-level working of the processor, like cache control, exception handling and such. One of the registers is the Counter Register (C0_COUNT), which is required to be present in all MIPS implementations, and which needs to increment at a constant rate while the processor is running. I thought this would be a good timer for counting the instruction cycles, however it turned out that the speed at which this register increments is implementation dependent, and in the DSTwo it gives no sensible values. The value stays the same for a few seconds, then changes to some completely different value. I could not make any sense of it's behaviour, so I had to look for another suitable cycle counter.
- The coprocessor 0 also contains a Performance Counter register set, which sounds just what I needed. However, the performance counter register support is only recommended, not required, and when I looked at the Configuration Register which tells which MIPS features are supported on the current hardware, it showed that the performance counters are not supported. Too bad.
- So, I had to look into the plain old timers to get some timing done. The DSTwo hardware has 6 timers, of which timer 0 seems to be used by the SDK itself, timers 4 and 5 are the ones that the SDK makes available from C code as timers 0 and 1 (with interrupt capability), and timer 3 I have used for emulating the secondary PC timer in my emulation. So, I decided to use the free hardware timer 1 for the cycle counter. However, the fastest timing that the timer can run at is 24MHz, which is pretty slow compared to the 360MHz CPU speed. When I used that I only got tick counts between 2 and 10, with most of the operations having the same number of ticks, so this was too coarse for my needs.
- Finally, I looked into the data sheet of the Timer/Counter Unit in the Ingenic documentation, and noticed that the timers can be driven by three different clock signals, EXTAL (external clock, which means the 24MHz clock crystal), RTCCLK (real-time clock), or PCLK (which is used for the APB bus peripherals, whatever that is). So, I decided to test what happens if I use the PCLK as the clock signal for my timer, and luckily I got notiecably bigger tick counts. If I interpreted the Clock Control Register bit masks correctly, it looks like the PCLK signal runs at 1/3 of the master clock signal, while the CCLK (CPU clock) runs at 1/2 of the master clock signal (both of these values were taken when the MIPS processor runs at it's default 360MHz speed). So, I don't get quite cycle-accurate counts, but the tick counts are big enough so that they can be used in measuring the performance.
Here is the first profiling result, while running the Doom demo. The first table shows the opcodes with the lowest minimum tick counts (ordered by that value), and the second table shows the opcodes taking the most total number of ticks (again ordered by that value):
opcodebytecountmin ticksavg tickstotal ticks% of totalcommandNOP90479991216.467901060.1921%No operationJNZ755611351316.6593402012.2708%Jump if not equalCLCF851414.00700.0000%Clear Carry flagDEC EDX4A304221416.455003700.1216%Decrement EDX register opcodebytecountmin ticksavg tickstotal ticks% of totalcommand??? r/m32,+imm8836071102031.33190217185.3878%Operations with signed immediate byte??? r/m32,imm32817489272128.09210405135.9596%Operations with immediate doublewordSize prefix664066932266.13268948367.6179%Operand-size prefixOpcode prefix0F6163882044.40273703357.7525%Various 386-opcodesMOV r32,r/m328B7976811737.42298490288.4546%Move to 32-bit registerMOV r8,r/m88A10485761934.113576828310.1312%Move to 8-bit register
Not surprisingly, the fastest opcode is
NOP, which is just a jump back to the opcode loop. Curiously though, even when the minimum ticks it takes is 12 (including the profiling overhead, which I estimate to be only 1 tick), on the average it takes over 4 ticks more! This might be due to some cache misses, but I'm a bit surprised that the cache misses happen so frequently that the effect is that big! But in any case, the 12 ticks is the baseline and that in principle shows how many ticks the main opcode loop takes.
Self-modifying code
Obviously, immediately after I had implemented the profiler, I wanted to use it to improve the speed of my emulation. The biggest improvement to the overall speed would be if I could improve the main opcode loop, as that would speed up everything. I had attempted to use self-modifying code back in October of last year, but could not get it to work reliably back then. I had attempted it again during my Xmas vacation, with the same results. However, I now thought that I finally understood what I did wrong during my previous attempts, and thus decided to try one more time.
The original opcode loop in DS2x86 looked like this (with some macros expanded for clarity): loop: lbu t0, 0(cseip) // Load the opcode byte from CS:EIP addu cseip, 1 // Increment the instruction pointer
lw t1, SP_OP(sp) // Load address of the current opcode table from stack sll t0, 2 // t0 = 4*opcode addu t1, t0 lw t1, 0(t1) // t1 = opcode_table[opcode] move eff_seg, eff_ds // Set DS to be the effective segment ori flags, FLAG_SEG_OVERRIDE // Fix the CPU flags, telling we have no segment prefix jr t1 // Jump to the opcode handlerAfter compilation the code stays pretty much the same, with some defines replaced and the assembler reordering the jump to fill the branch delay slot:
800b6020 <loop>:800b6020: 93c80000 lbu t0,0(s8)800b6024: 27de0001 addiu s8,s8,1800b6028: 8fa9000c
lw t1,12(sp)800b602c: 00084080 sll t0,t0,0x2800b6030: 01284821 addu t1,t1,t0800b6034: 8d290000 lw t1,0(t1)800b6038: 01e0f821 move ra,t7800b603c: 01200008 jr t1800b6040: 37390002 ori t9,t9,0x2I wanted to get rid of the opcode table address load from stack (the line in bold text in the code snippets). This address changes very infrequently, it only changes when an IRQ needs to be handled (a few hundred times per second), or when the processor switches between modes (real mode / protected mode / USE16 code segment / USE32 code segment). Thus it feels very wasteful loading the address from memory for every single opcode. In theory I could keep the address in a register, however it would then be very difficult to change the address from an interrupt handler, as that would require some obscure stack frame handling to make the interrupt return pop a different value to the register. Very ugly and error-prone.
A simpler solution would be to have the address as an immediate value of the opcode, as that is in memory and can be changed from the interrupt handler, and it does not need an extra memory load in the opcode loop. The problem I had been running into was that the processor did not always see that I had changed the code it was running. At the time I did not realize that I had not used the correct cache commands to force the data cache to write it's value into memory, and to invalidate this address from the instruction cache.
I coded the new opcode loop handling and changed all the code that previously wrote the opcode table address to the stack to write the value directly to the immediate values of the opcodes, using the correct cache commands this time, and it worked! No hangs or other weird behaviour, everything seemed to work fine!
I'll show the new loop code in a moment, but as I also made another improvement before I profiled it, I'll show the cache handling first, then talk about the other optimization, and only after that show the new code and the resulting profiler info. The correct cache commands to force the flushing of the data cache and invalidating the instruction cache are the following (when the AT register contains the memory address of the opcode to invalidate): cache 0b10101, 0(AT) // Primary Data Cache - Hit Writeback Invalidate - Address sync cache 0b10000, 0(AT) // Instruction Cache - Hit Invalidate - Address
Using the GP register
The MIPS architecture defines one register, the
Global Pointer (GP) for use by the toolchain to speed up memory access of often-used variables. Since the MIPS architecture has only 16-bit immediate values, all 32-bit values that need to be put into registers have to be built by two 16-bit parts. Similarly with memory addresses, for example the assembler expands this: lw t0, VGA_latchinto this:
lui t0, %hi(VGA_latch) lw t0, %lo(VGA_latch)(t0)That is, first the high 16 bits of the memory address are loaded into the t0 register, then it is used as a base register, with the low 16 bits of the variable address as an immediate 16-bit offset, to load the actual value. Thus, all simple-looking variable accesses actually take two CPU instructions to execute. To speed up the memory accesses, the toolchains use the
GP register to point into the middle of a 64KB-sized memory area (a
small data region with a segment name
.sdata). Since the immediate 16-bit offset is a signed value, the GP register needs to point into the middle of this area to be able to access the full 64 kilobytes.
I had purposefully left the GP register unused in my ASM code, as I did not know how best to take advantage of the 64KB area, and as I did not know whether the C modules already use this area. However, now that I was able to use self-modifying code, I thought that if I had the opcode tables in this small data area, I could simply change the low 16 bits of the address (in other words the immediate offset) to have the main opcode loop point to different opcode tables. Each opcode table has 256 entries, and I have 8 opcode tables plus the IRQ opcode table, totalling 4*256*9 = 9216 bytes. Well within the 64KB limit, and I could still fit some other frequently used variables in there, provided the C code does not take all of the space.
I then looked into how the SDK uses the GP register and the small data area, and somewhat to my surprise, the
start.S does setup the GP register to point to the
_gp memory address, which the
link.xn linker script has created between the data and bss segments, but it looked like no code actually uses it for anything! The symbol dump file showed that the bss area began immediately after the _gp variable. So, the whole 64KB was free for my own use! Actually, it looked like the linker script creates the _gp variable at the beginning of the small data segment, so it can actually address only 32KB of memory. But even that will be plenty for my needs.
So with the self-modifying opcode table offset, and the GP register containing the start of the small data area, I was able to change my main opcode loop to look like this: loop: lbu t0, 0(cseip) // Load the opcode byte from CS:EIP addu cseip, 1 // Increment the instruction pointer sll t0, 2 // t0 = 4*opcode addu t1, gp, t0 // t1 = small data segment address + opcode*4sm_op: lw t1,
0(t1) // Imm16 offset self-modified to contain the opcode table offset within the small data segment move eff_seg, eff_ds // Set DS to be the effective segment ori flags, FLAG_SEG_OVERRIDE // Fix the CPU flags, telling we have no segment prefix jr t1 // Jump to the opcode handlerOr shown from the dump file:
80101e20 <loop>:80101e20: 93c80000 lbu t0,0(s8)80101e24: 27de0001 addiu s8,s8,180101e28: 00084080 sll t0,t0,0x280101e2c: 03884821 addu t1,gp,t080101e30 <sm_op>:80101e30: 8d29
0000 lw t1,
0(t1)80101e34: 01e0f821 move ra,t780101e38: 01200008 jr t180101e3c: 37390002 ori t9,t9,0x2This is the full macro that changes the opcode table offset to point to the opcode table, whose address is in the register given as a parameter to the macro:
.macro set_current_opcode_table reg .set noat la AT, _gp // Get the address of the _gp variable subu \reg, AT // Subtract the _gp address from the table address, to get the imm16 offset la AT, sm_op // Get the address of the opcode we are to modify sh \reg, 0(AT) // Store the 16-bit (halfword) offset value into the opcode cache 0b10101, 0(AT) // Primary Data Cache - Hit Writeback Invalidate - Address sync cache 0b10000, 0(AT) // Instruction Cache - Hit Invalidate - Address .set at.endm
Okay, so now I was ready to run my profiler again, to see what kind of an effect this change had. I expected to see improved performance for every opcode. Here are the profiling results after the change:
opcodebytecountmin ticksavg tickstotal ticks% of totalImprovementcommandNOP90457901113.786307630.18 53%
16%No operationJNZ755602681315.8488762312.6082%
5%Jump if not equalCLCF831313.00390.0000%
7%Clear Carry flagDEC EDX4A136581316.502253340.0662%
0%Decrement EDX register opcodebytecountmin ticksavg tickstotal ticks% of totalImprovementcommand??? r/m32,+imm8835843281930.07175697125.1627%
4%Operations with signed immediate byte??? r/m32,imm32817729042026.64205864256.0492%
5%Operations with immediate doublewordSize prefix664027262165.60264179987.7627%
1%Operand-size prefixOpcode prefix0F6447782042.16271821757.9873%
5%Various 386-opcodesMOV r32,r/m328B7878381736.61288430748.4753%
2%Move to 32-bit registerMOV r8,r/m88A10485761733.903555059610.4463%
1%Move to 8-bit register
All in all, the performance improvement was rather minor. I had hoped this change would have caused more of an improvement. In any case, now I am happy with the main opcode loop, it is now as fast as I can make it, so I need to look elsewhere for extra performance. The next performance improvent task I plan to do is to move all the EGA/VGA variables into the small data segment and access them using the GP register. I also plan to look into those most time-consuming operations more closely, to determine if there are some optimization possibilities there. The opcode prefix 0x66 at least could also be made to use the GP register, for example.
New opcodes implemented
After working on the profiler and performance improvements for a few days, it was time to get back to adding the missing opcodes. Based on the log files you have been sending (thanks!), I selected a couple of new DOS4GW games to download and test myself. I first started with
Worms by Team 17, and after several iterations of adding various missing opcodes, it started working! I actually have no idea how to play it, so I'm not sure if it works properly, but at least the beginning of the game looks to behave very similarly to how it behaves in DOSBox, so I'll leave the rest of the testing to you (when I release the next version).
The game I am currently working on is
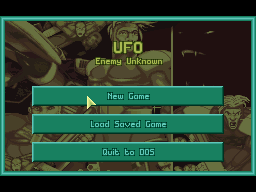
UFO: Enemy Unknown. It has some strange problem that it hangs after the intro when running the start.bat, but when running the go.com it progresses up to the start of the game, where it encounters an unsupported opcode. Around this opcode are a lot of floating point operations (which I do not plan to support), so I am not yet sure whether the actual game will work. We shall see.


All in all the opcode changes I have needed to do for DS2x86 have been quite straightforward, I haven't had to make any changes to the more difficult protected mode features. Looks like my emulation already handles the features the DOS4GW extender needs, so many games should run in DS2x86 after I get the plain opcode support more complete. That is very encouraging, it looks like DS2x86 might become quite useful in the near future.
DSx86 progress
I started working on the better scaling methods for the original DSx86. I began with the MCGA 320x200 256-color mode, as that is the easiest, which was a good thing as I had been working so long with the MIPS assembler that going back to the ARM assembly language was somewhat difficult. I couldn't immediately remember what opcode it was to store a byte into memory, how to branch after a subtraction if the result is zero, etc. These operations are so different in MIPS that it took a while to get back up to speed with the ARM assembly.
I kept coding the scaling routine during the 7-minute FTP transfers of the DS2x86 to the SD card via WiFi. Actually during one such transfer I was able to build, test, fix and build DSx86 again four times! Testing DSx86 is so much faster than testing DS2x86 that it felt pretty good getting back to working on it!
In any case, I managed to code the smooth scaling for the MCGA mode (which will replace the current
Jitter mode, which I think has never been all that useful). However, at least in No$GBA DSx86 hangs immediately when using the smooth scaling mode and attempting to set the screen refresh rate to 60fps. This suggests that the smooth scaling routine takes more than 1/60th of a second to run, which also means that at 30fps it takes more than half of the available CPU cycles! The code is currently pretty much a direct port from the MIPS code in DS2x86, so I might be able to improve it's performance a bit. However, looks like the smooth scaling method will not be very useful unless you have a DSi and you are able to run DSx86 in DSi mode. In the smooth scaling version I still use hardware scaling to scale vertically from 200 to 192 rows, I'm not sure if I will keep it this way or if I will use the same system as in DS2x86, where you still need to scroll vertically even when using the scaled screen mode.
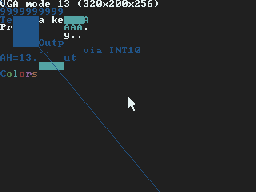
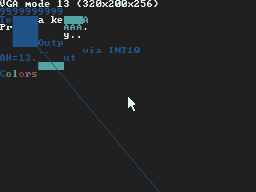
The following No$GBA screen copies are from my BIOS graphics routines test program, which I have used to test all the graphics modes of DSx86. They give some sort of an idea about the difference between the hardware scaling and the new smooth scaling.


Well, that's it for this blog post, which actually became quite long and full of various things I thought might be worth mentioning. Hope you didn't get bored reading it! Next weekend I plan to release DS2x86 0.04 and DSx86 0.25, if all goes well.
http://dsx86.patrickaalto.com/DSblog.html
 NES
NES
